The FYN Intelligence Blog
Playbooks for property operators.
Tenant intake, vendor dispatch, and the operational details that decide whether a repair takes 4 hours or 4 weeks.
Leasing Velocity
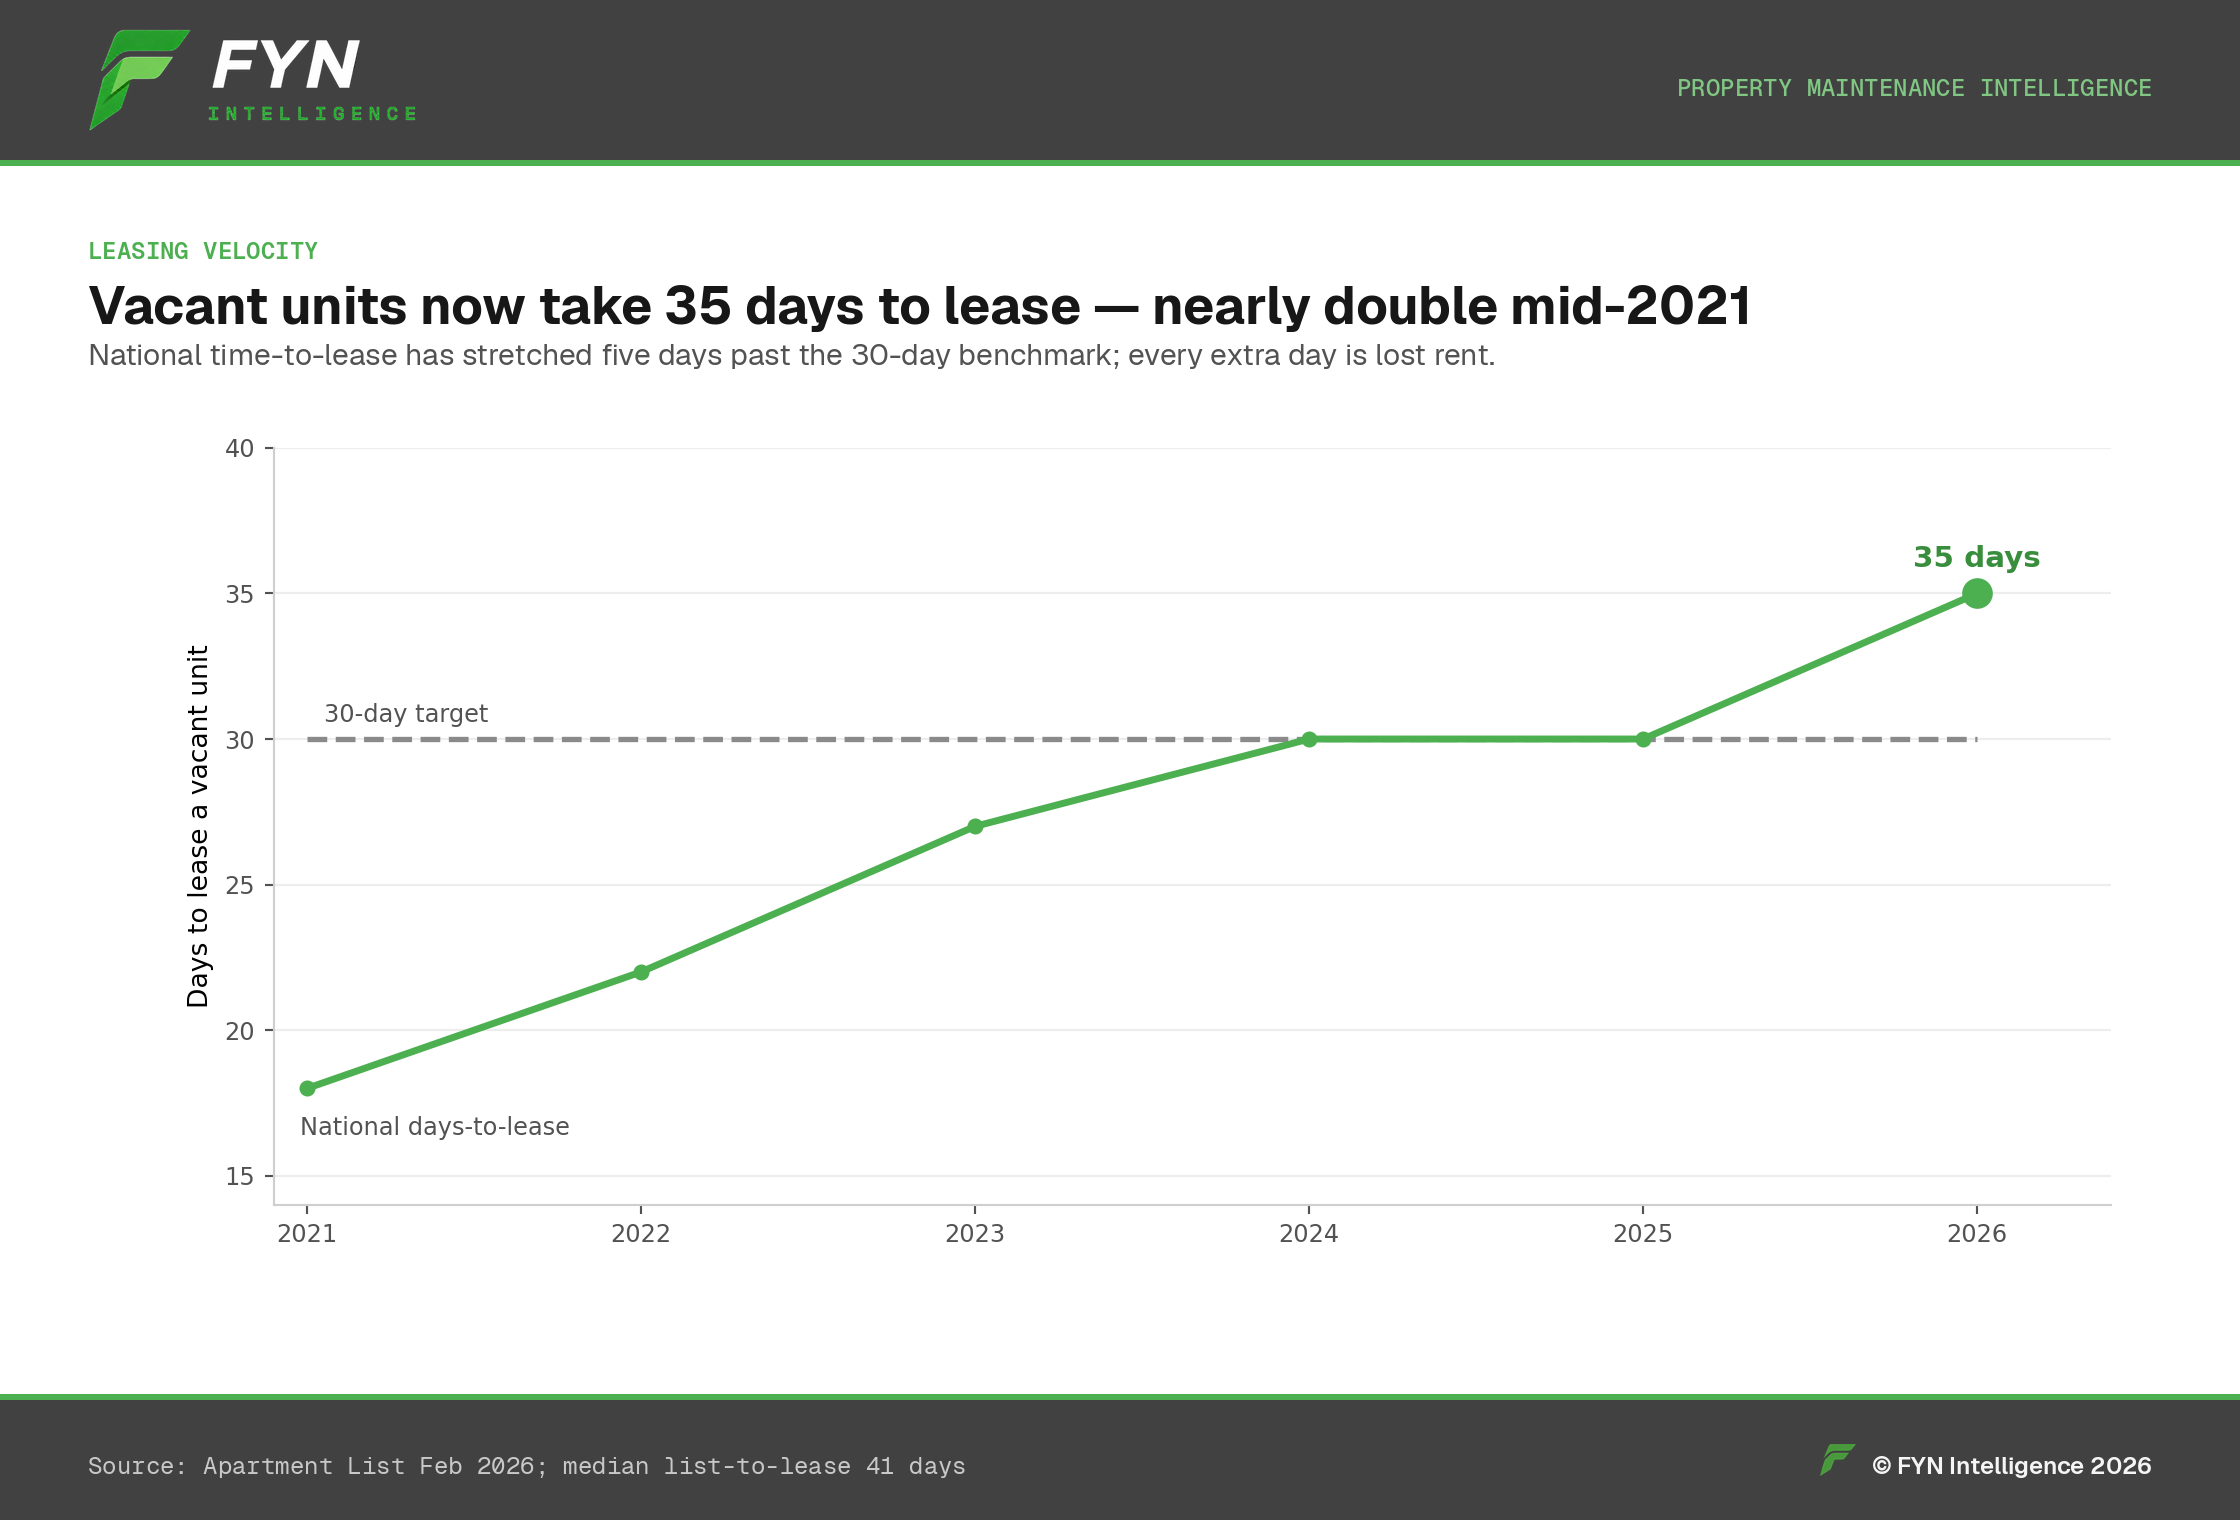
Vacant Units Now Take 35 Days to Lease
The physical turn only needs a week — the other three weeks are coordination drag, and that's the part you can control.
Aug 4, 20266 min read
Distress
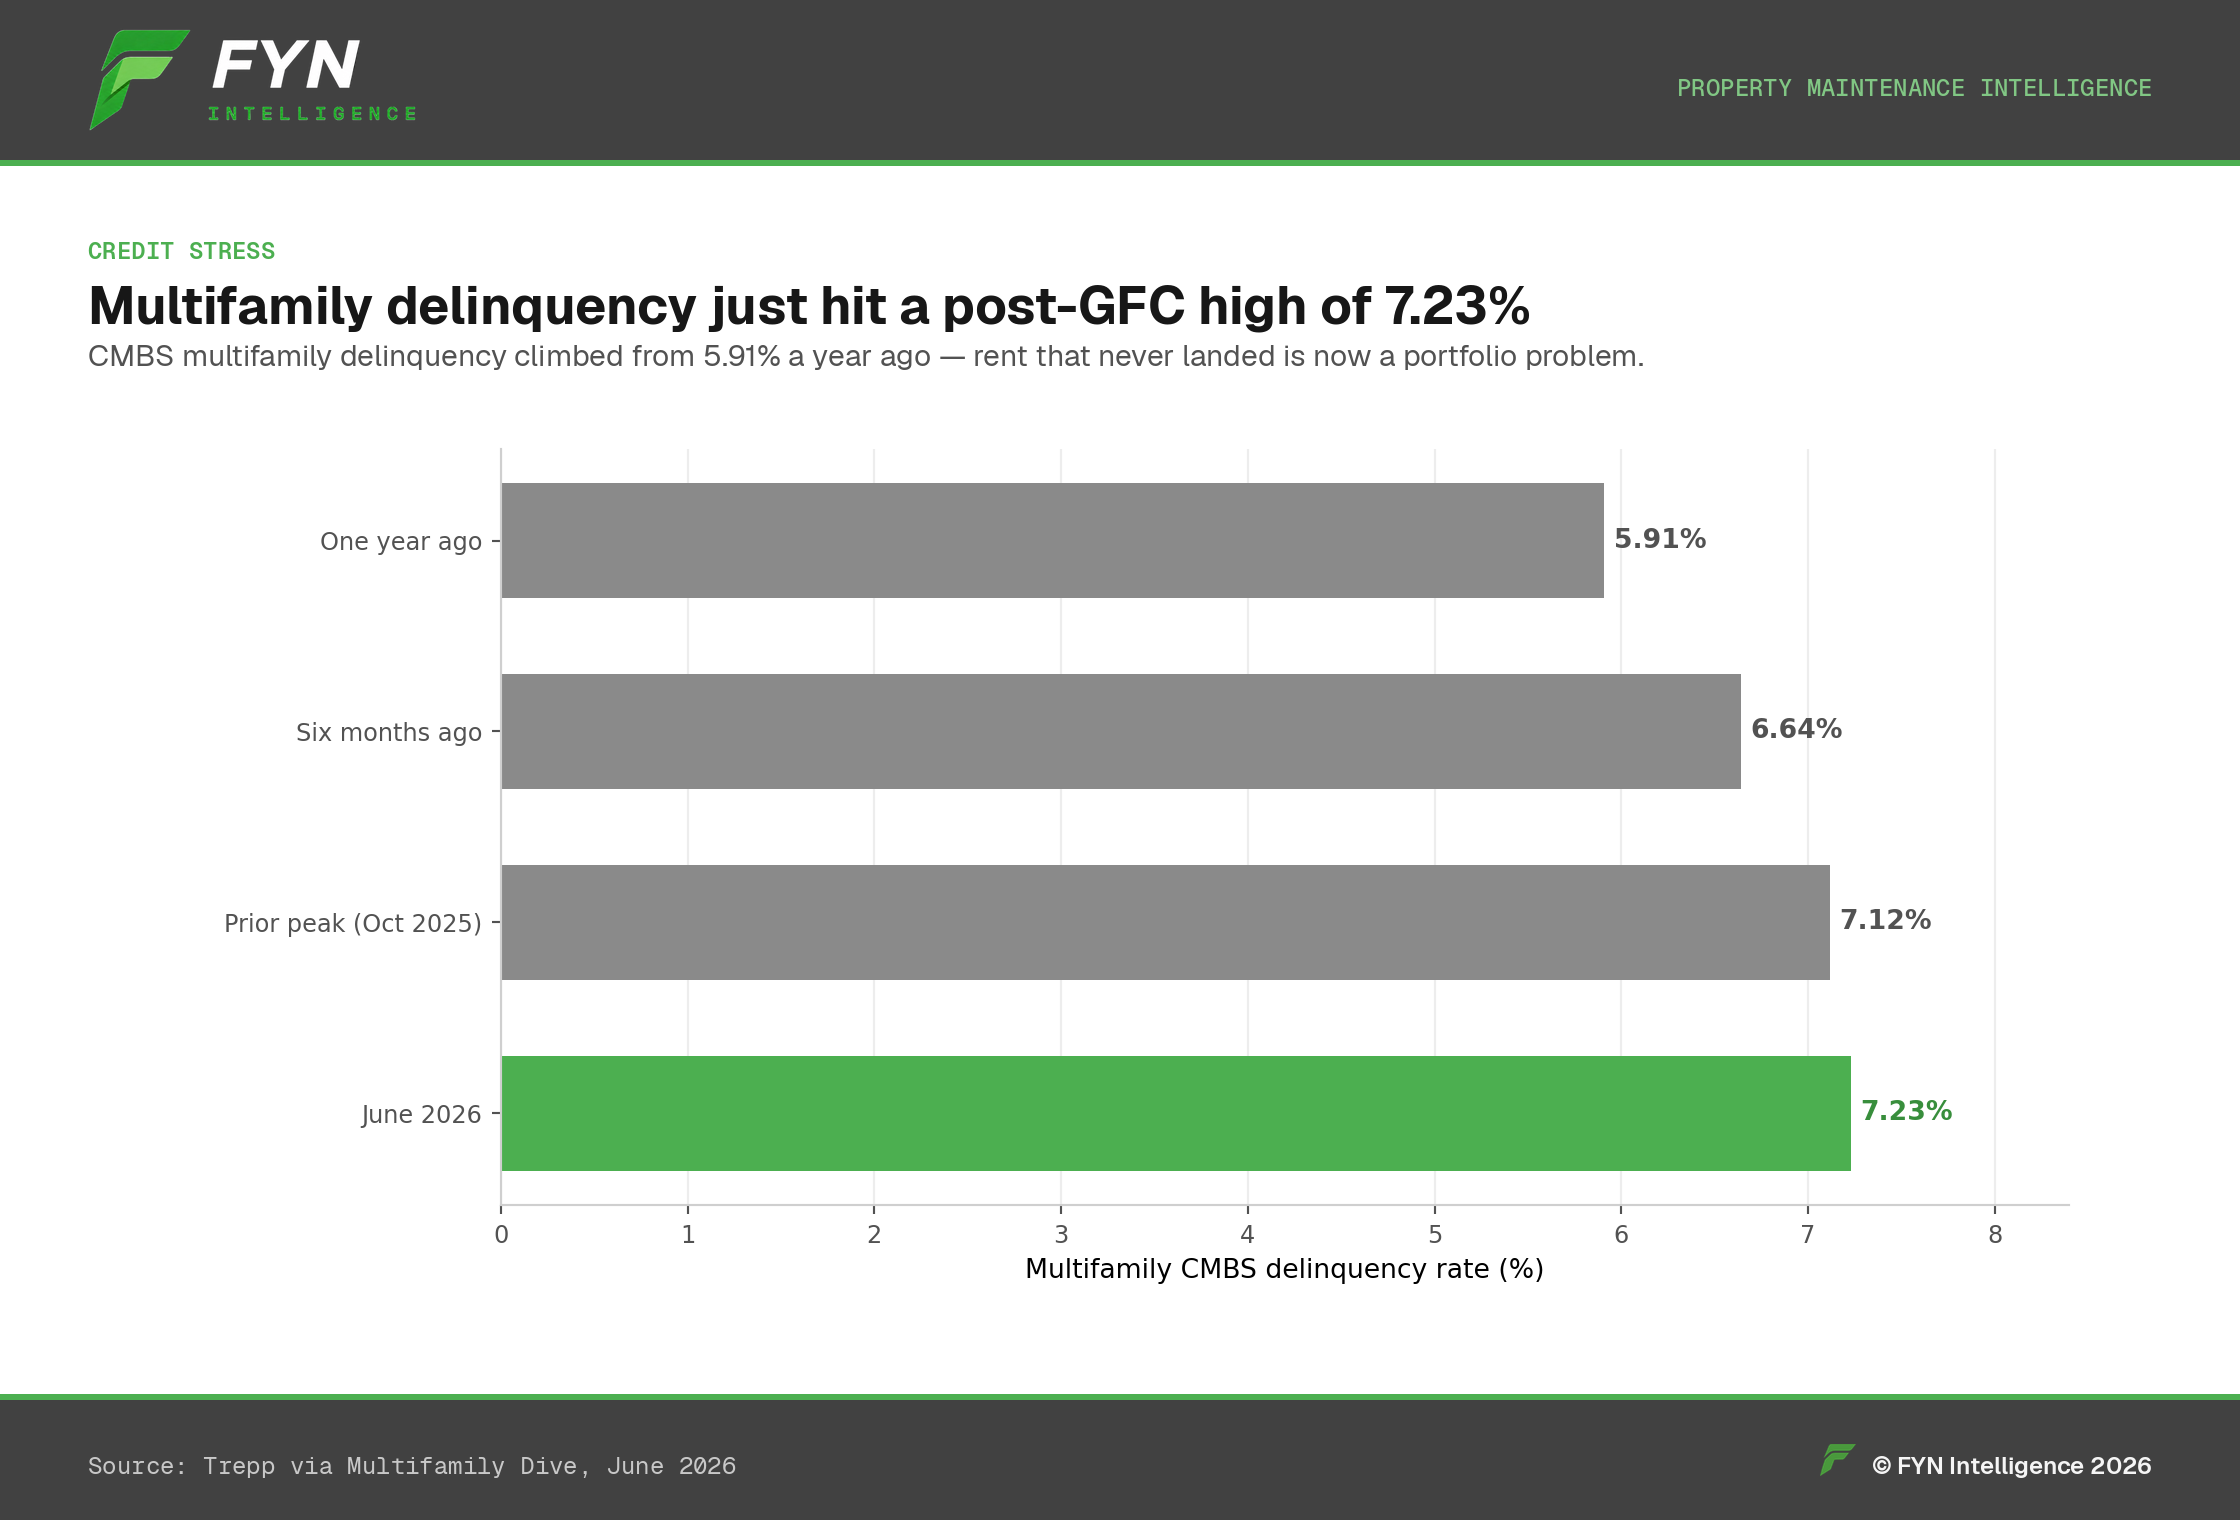
Multifamily Delinquency Hit a Post-GFC High of 7.23%
Up from 5.91% a year ago and past the prior peak — rent that never lands becomes a portfolio-level problem.
Aug 4, 20265 min read
Risk
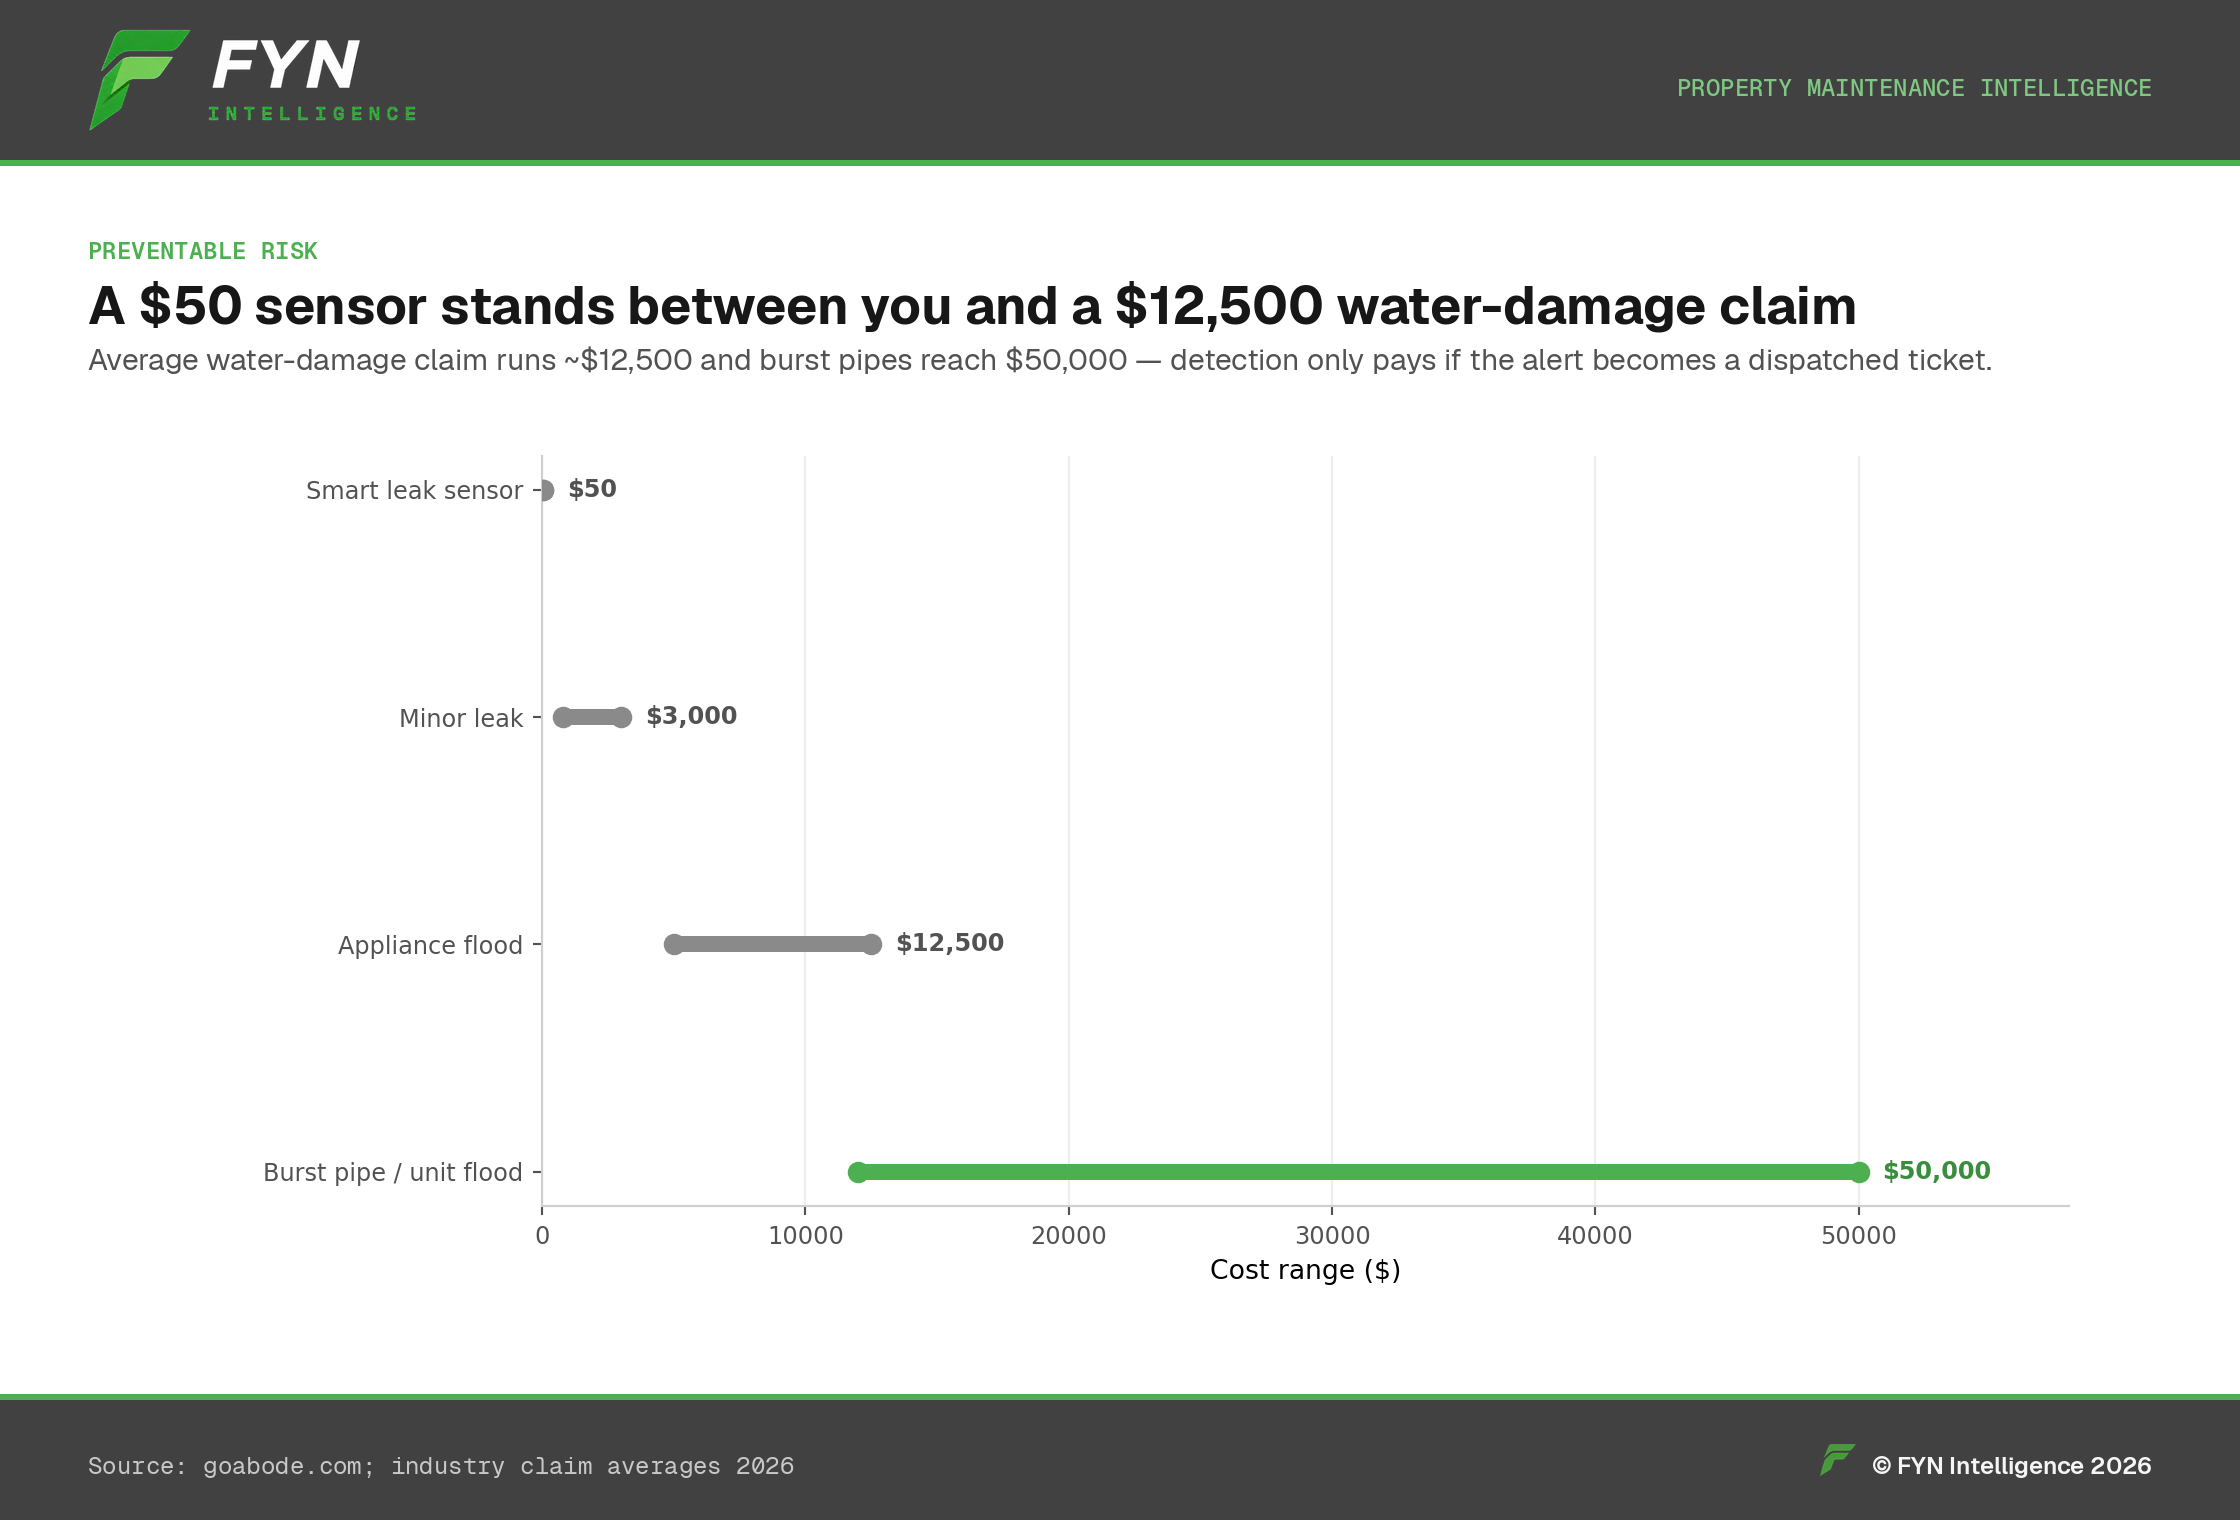
A $50 Sensor Stands Between You and a $12,500 Water-Damage Claim
A ~250× ROI — but only if the alert becomes a dispatched ticket, not a ping in an inbox nobody watches.
Aug 4, 20265 min read
Operations
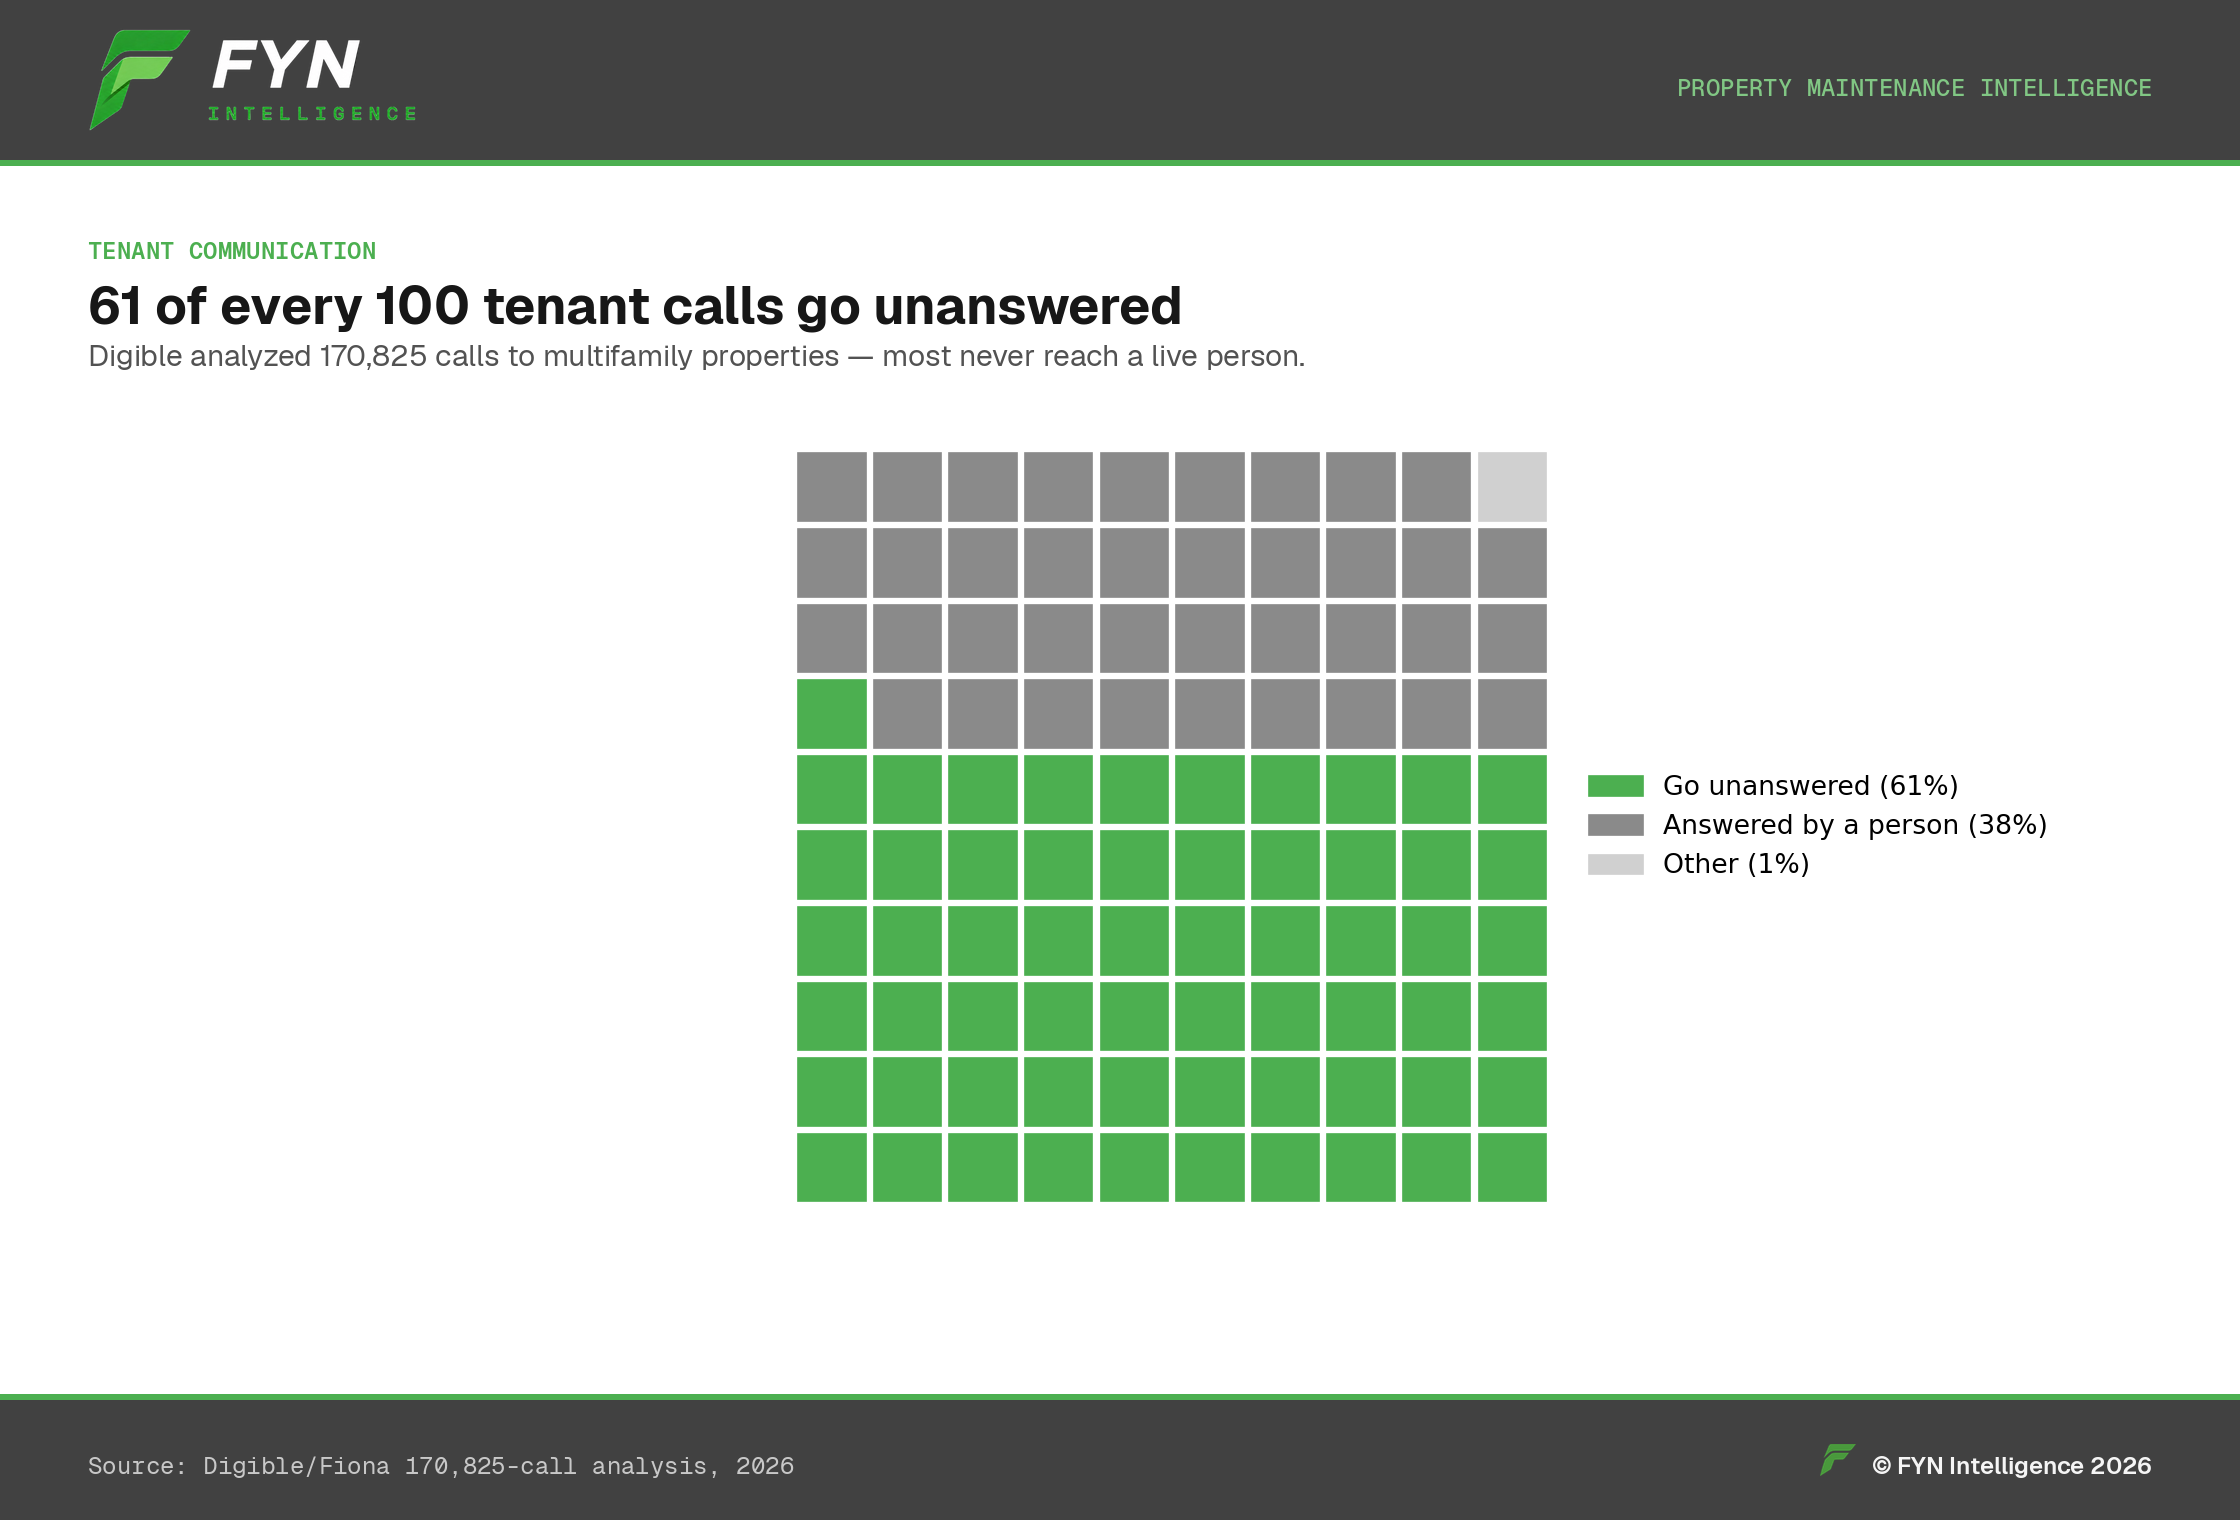
61 of Every 100 Tenant Calls Go Unanswered
Every missed call is a repair you didn't log — and it resurfaces as an emergency dispatch, a bad review, or a non-renewal.
Aug 4, 20266 min read
Industry Labor
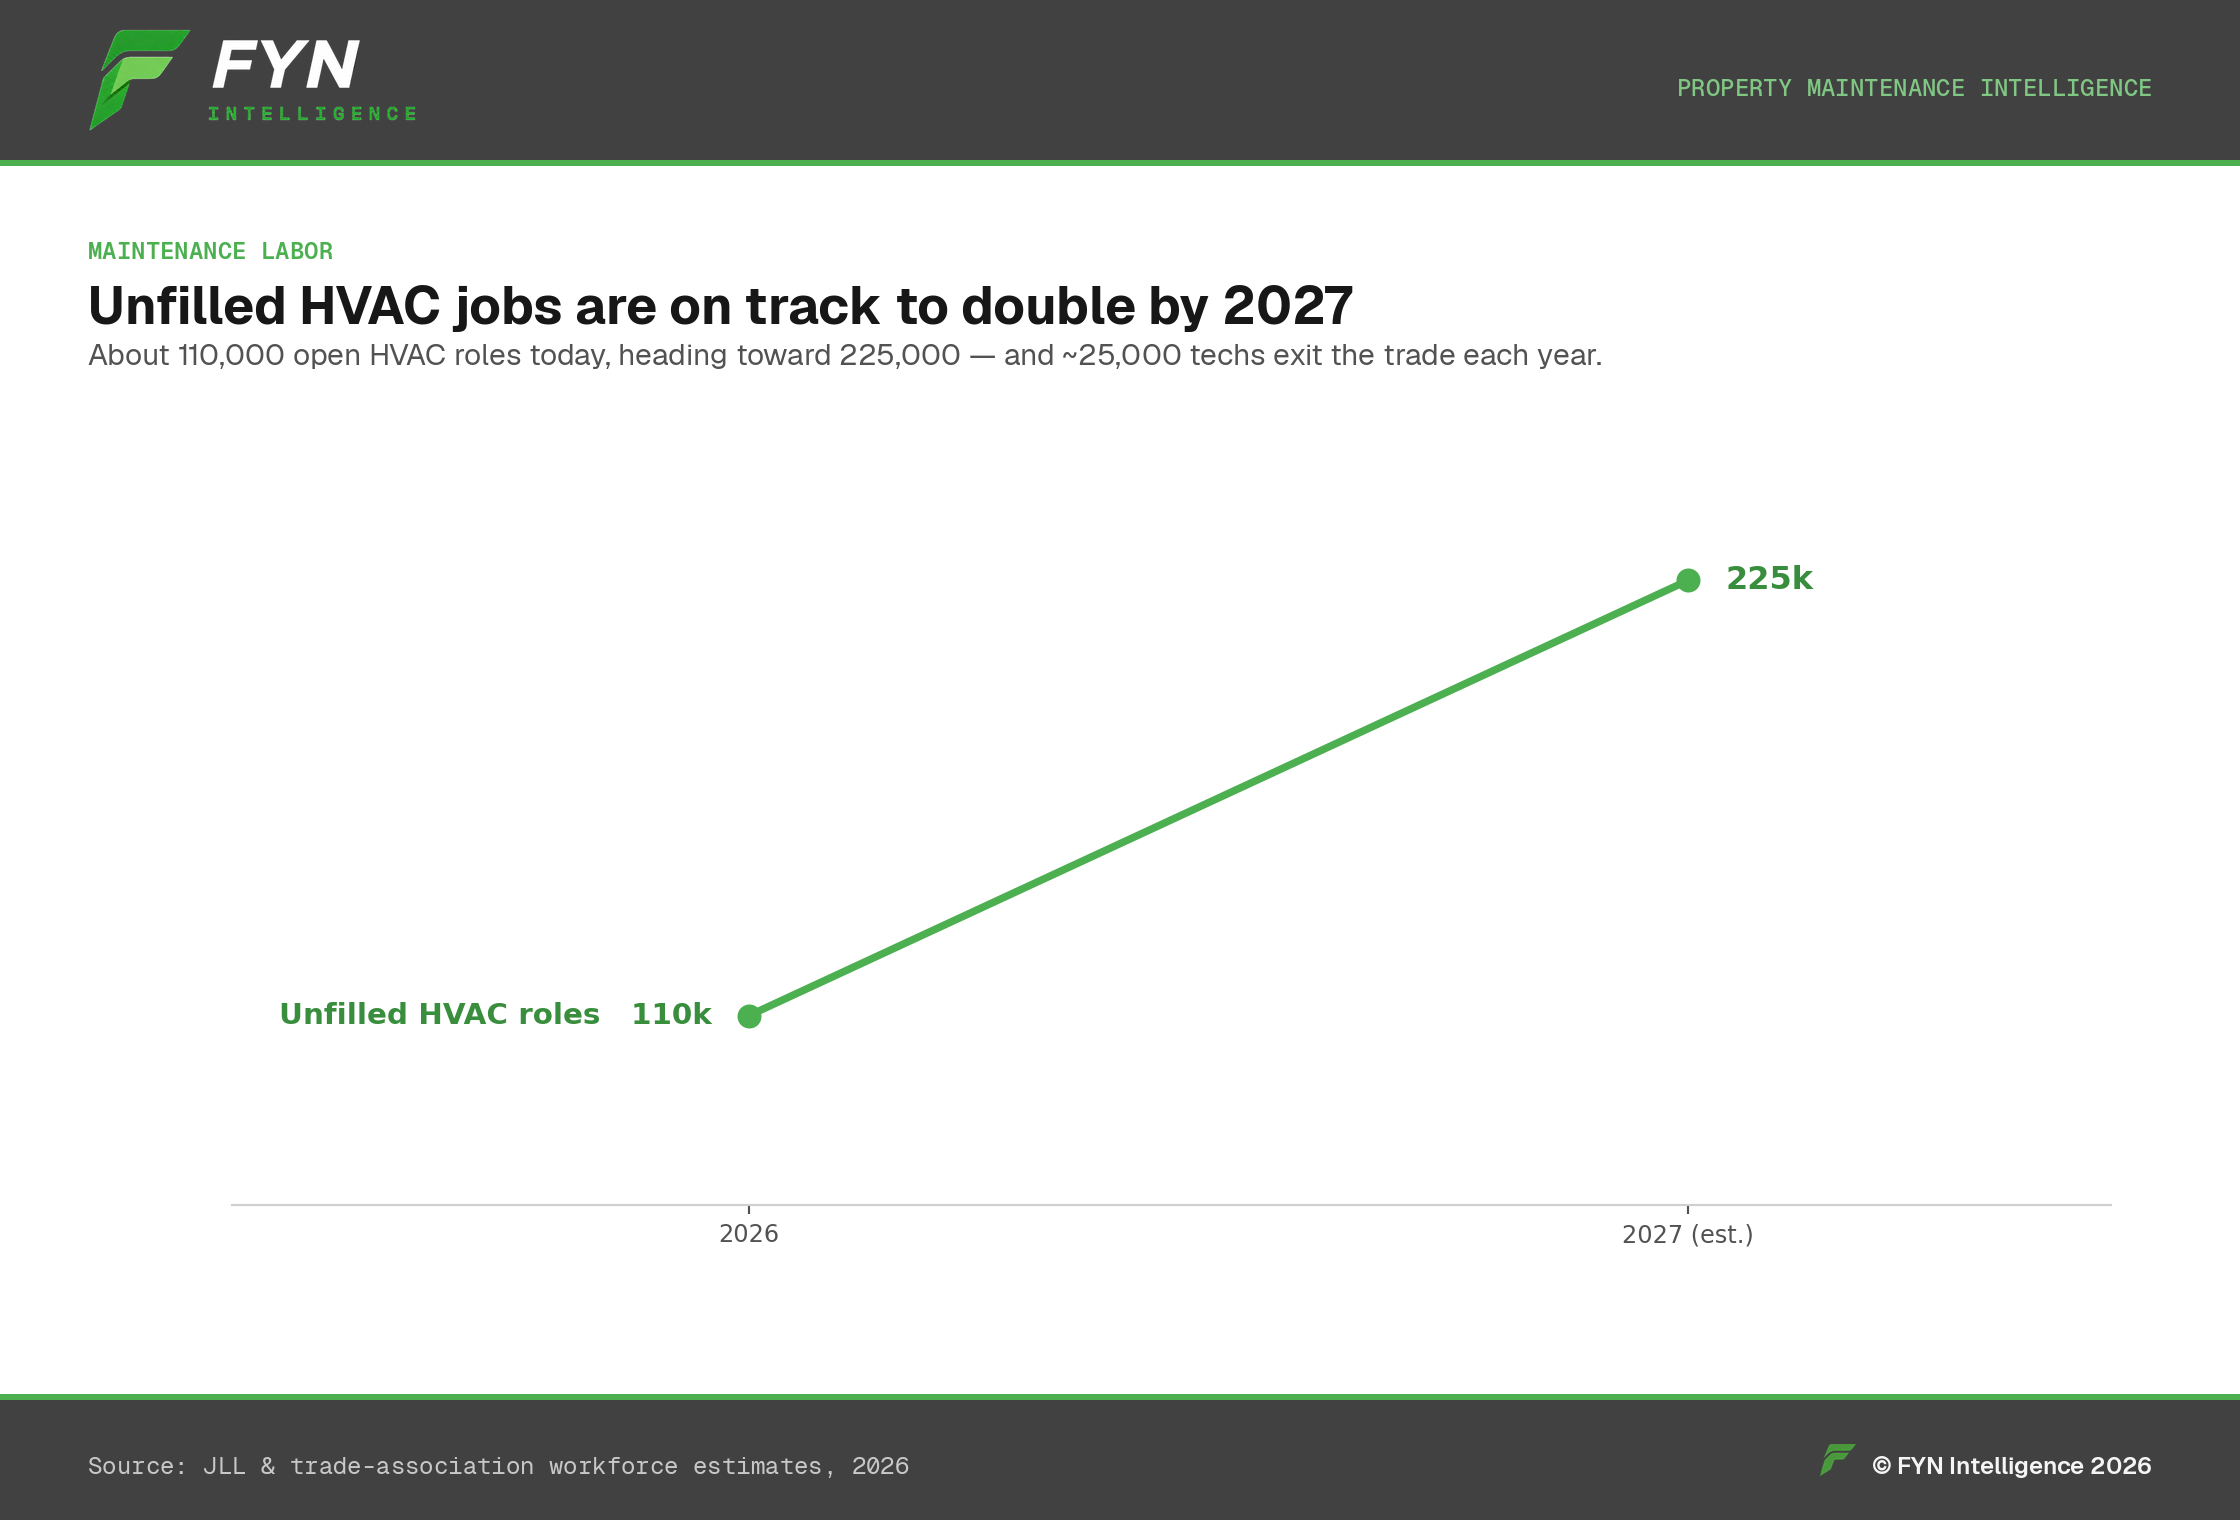
Unfilled HVAC Jobs Are on Track to Double by 2027
As the in-house and vendor labor pool tightens, knowing which trades actually perform becomes a survival skill.
Aug 4, 20265 min read
Insurance
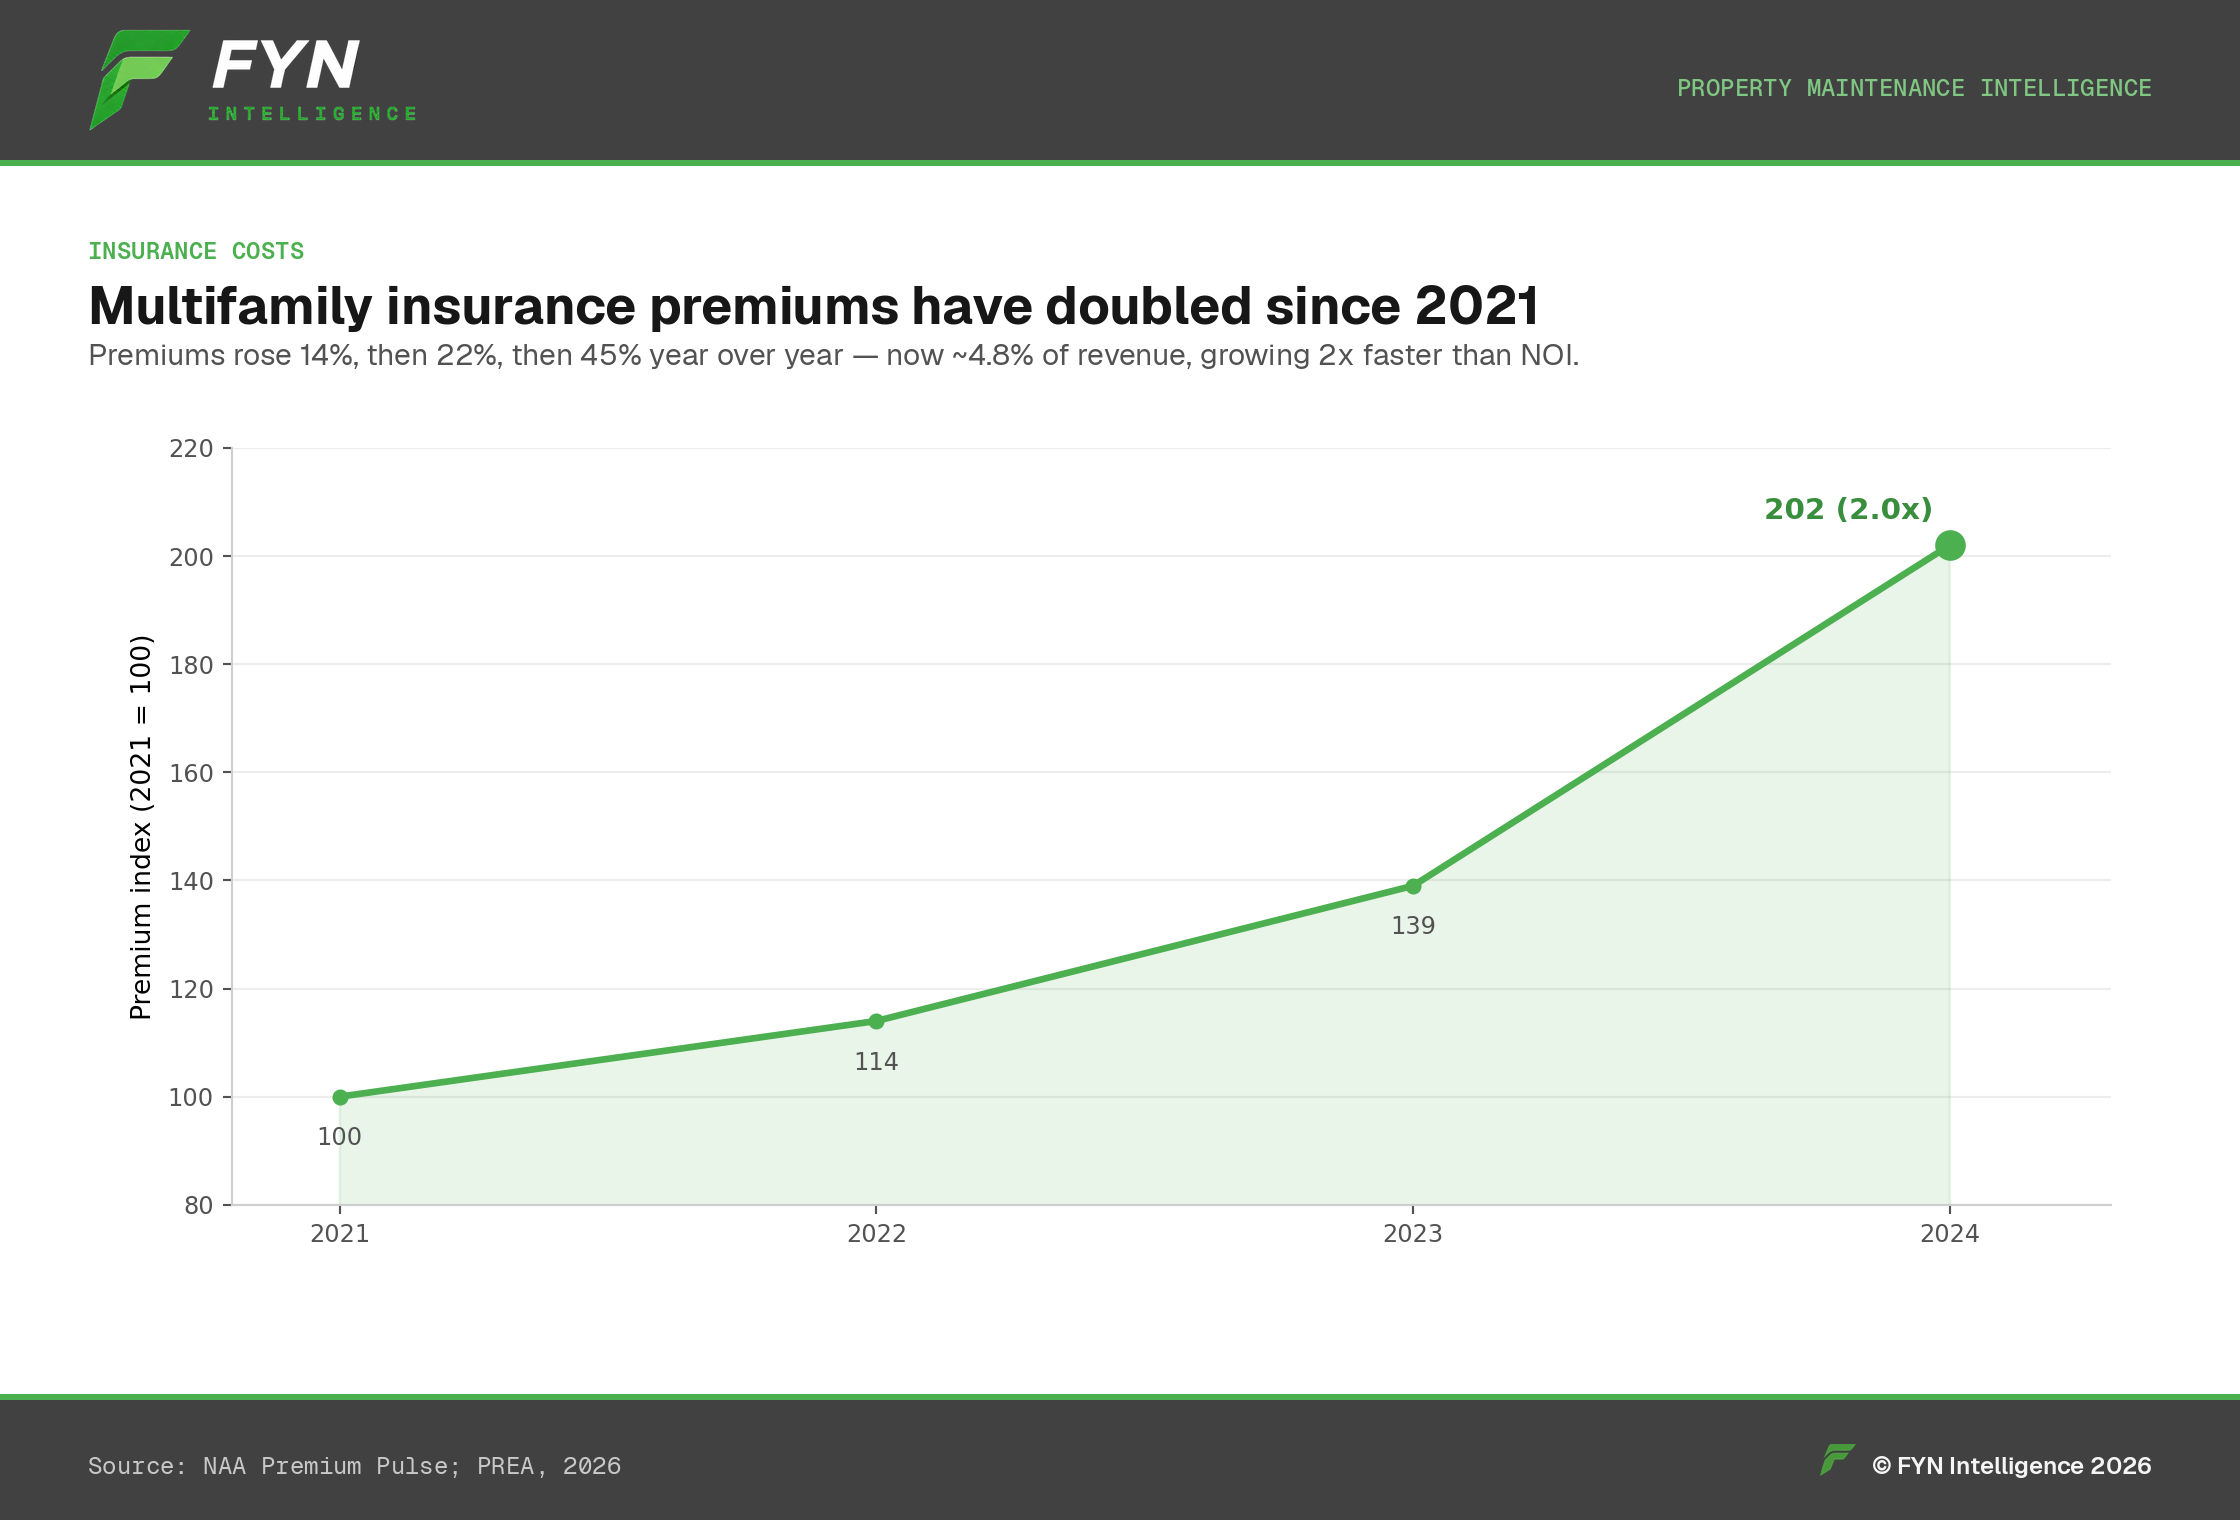
Multifamily Insurance Premiums Have Doubled Since 2021
Insurance now runs ~4.78% of revenue versus 1.95% in 2000 — growing more than twice as fast as NOI.
Aug 4, 20265 min read
Housing Supply
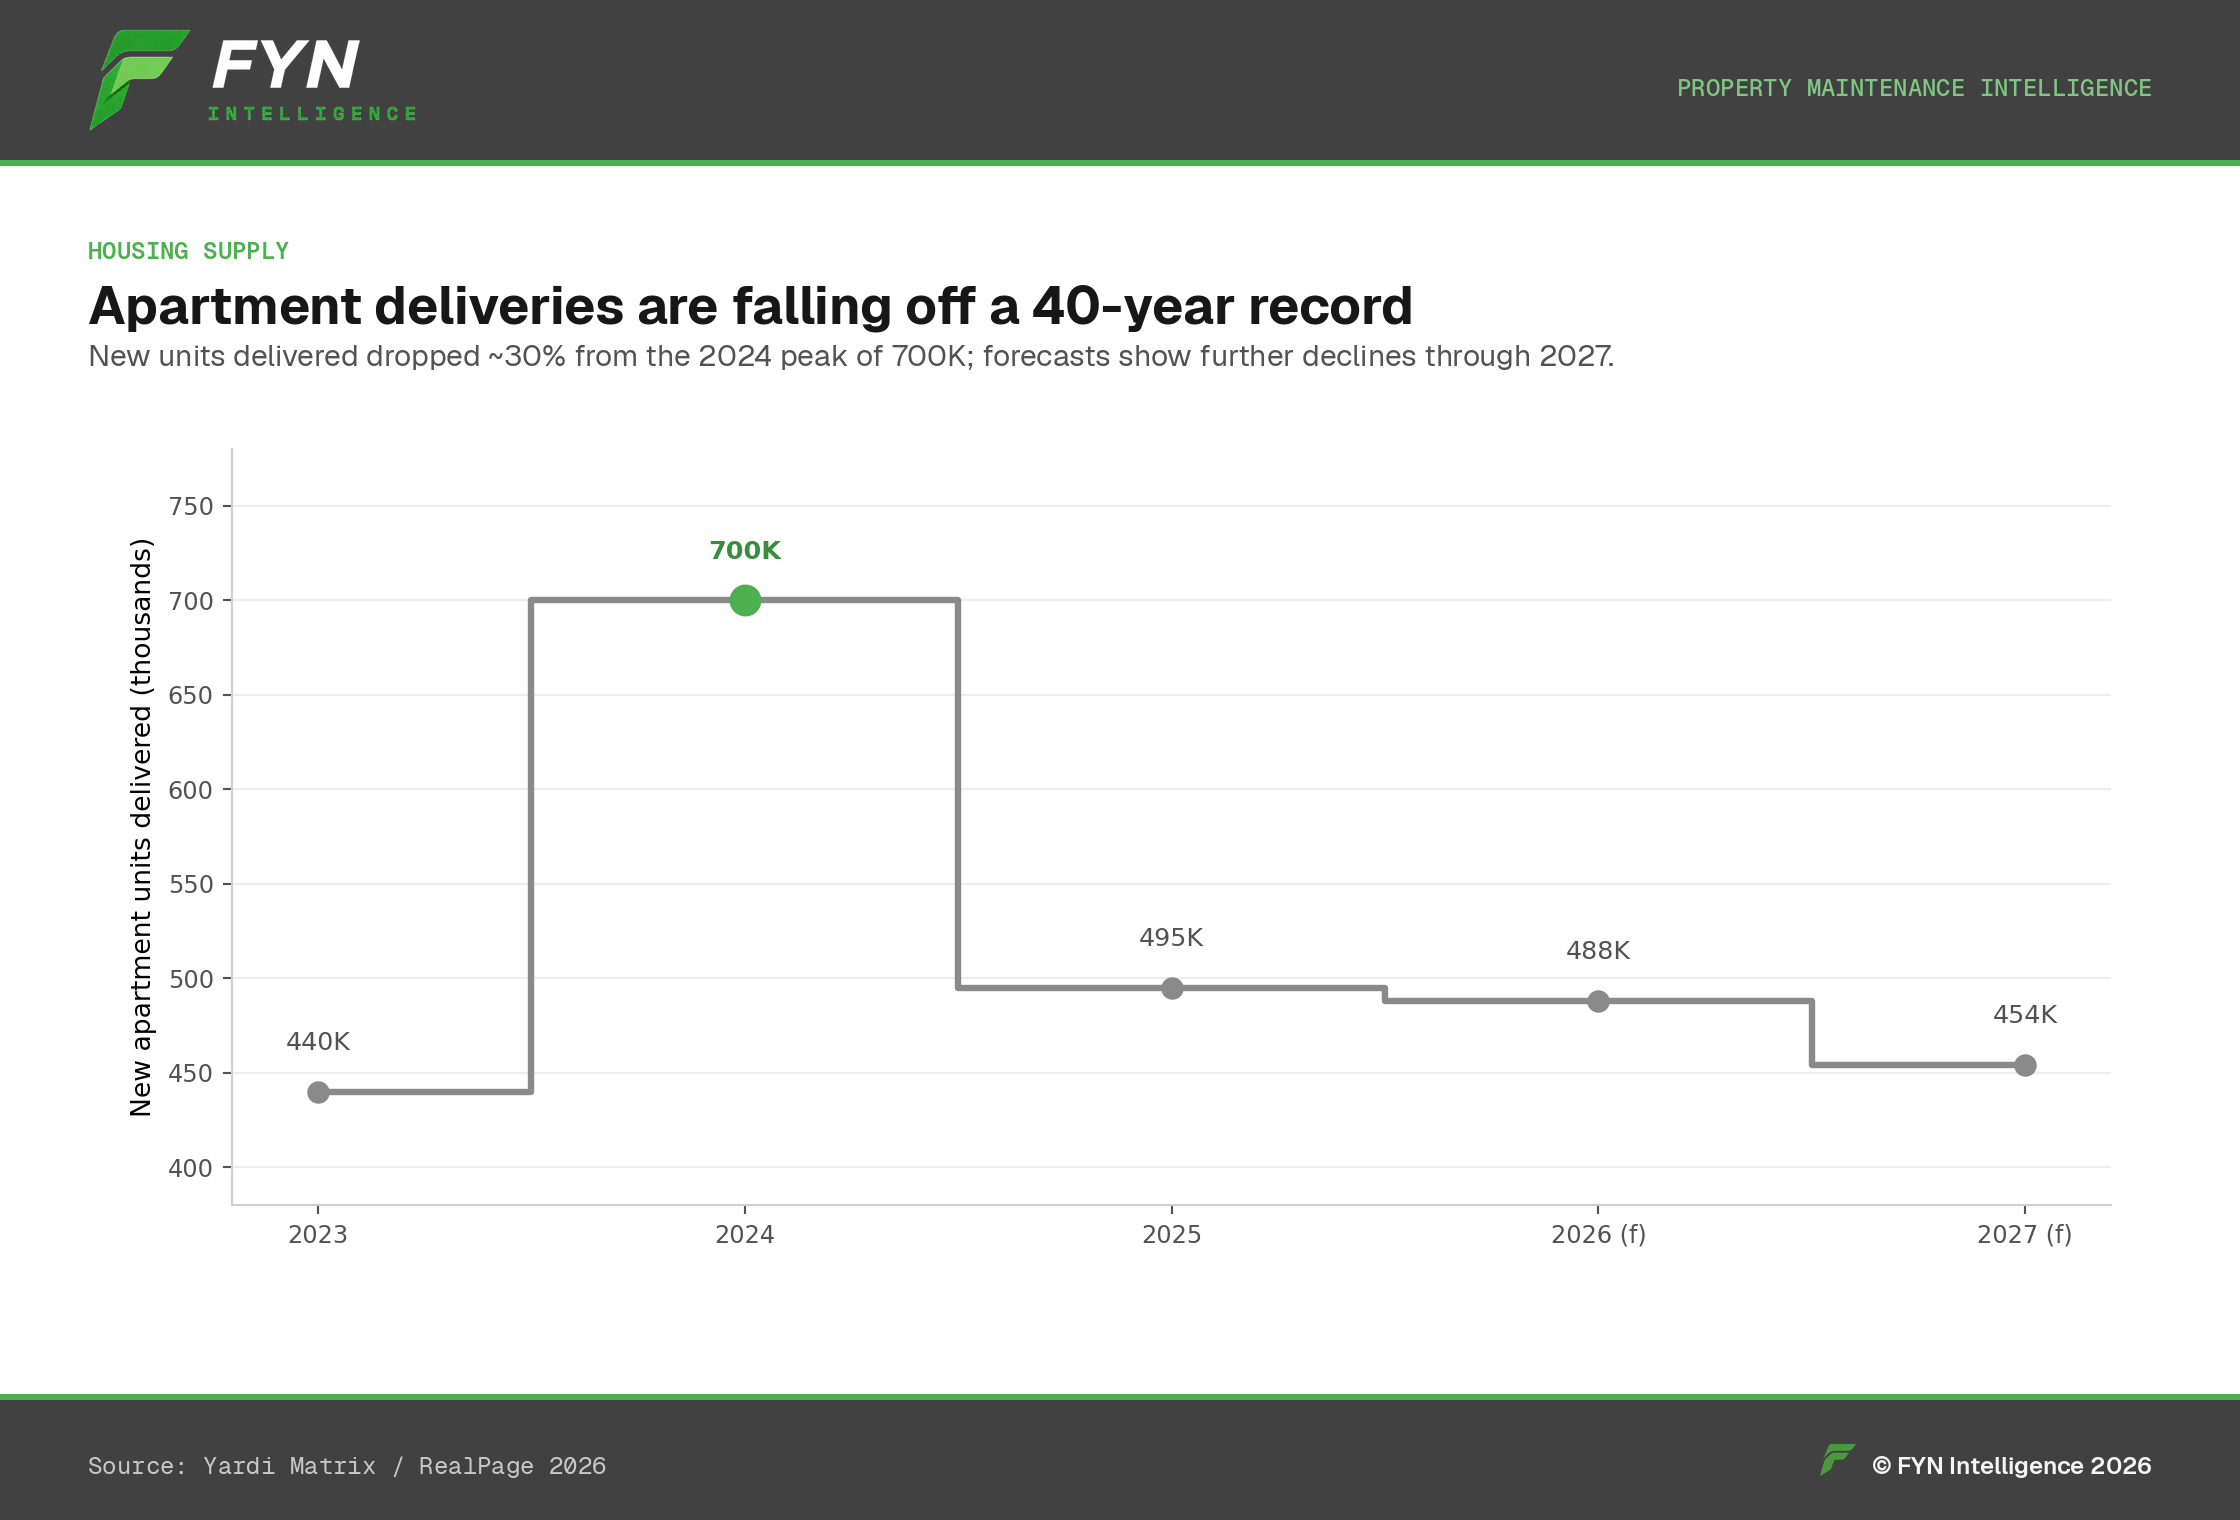
Apartment Deliveries Are Falling Off a 40-Year Record
Starts have collapsed to their lowest quarterly level since 2011, setting up a supply cliff in 2027–2028.
Jul 22, 20266 min read
Seasonal Maintenance
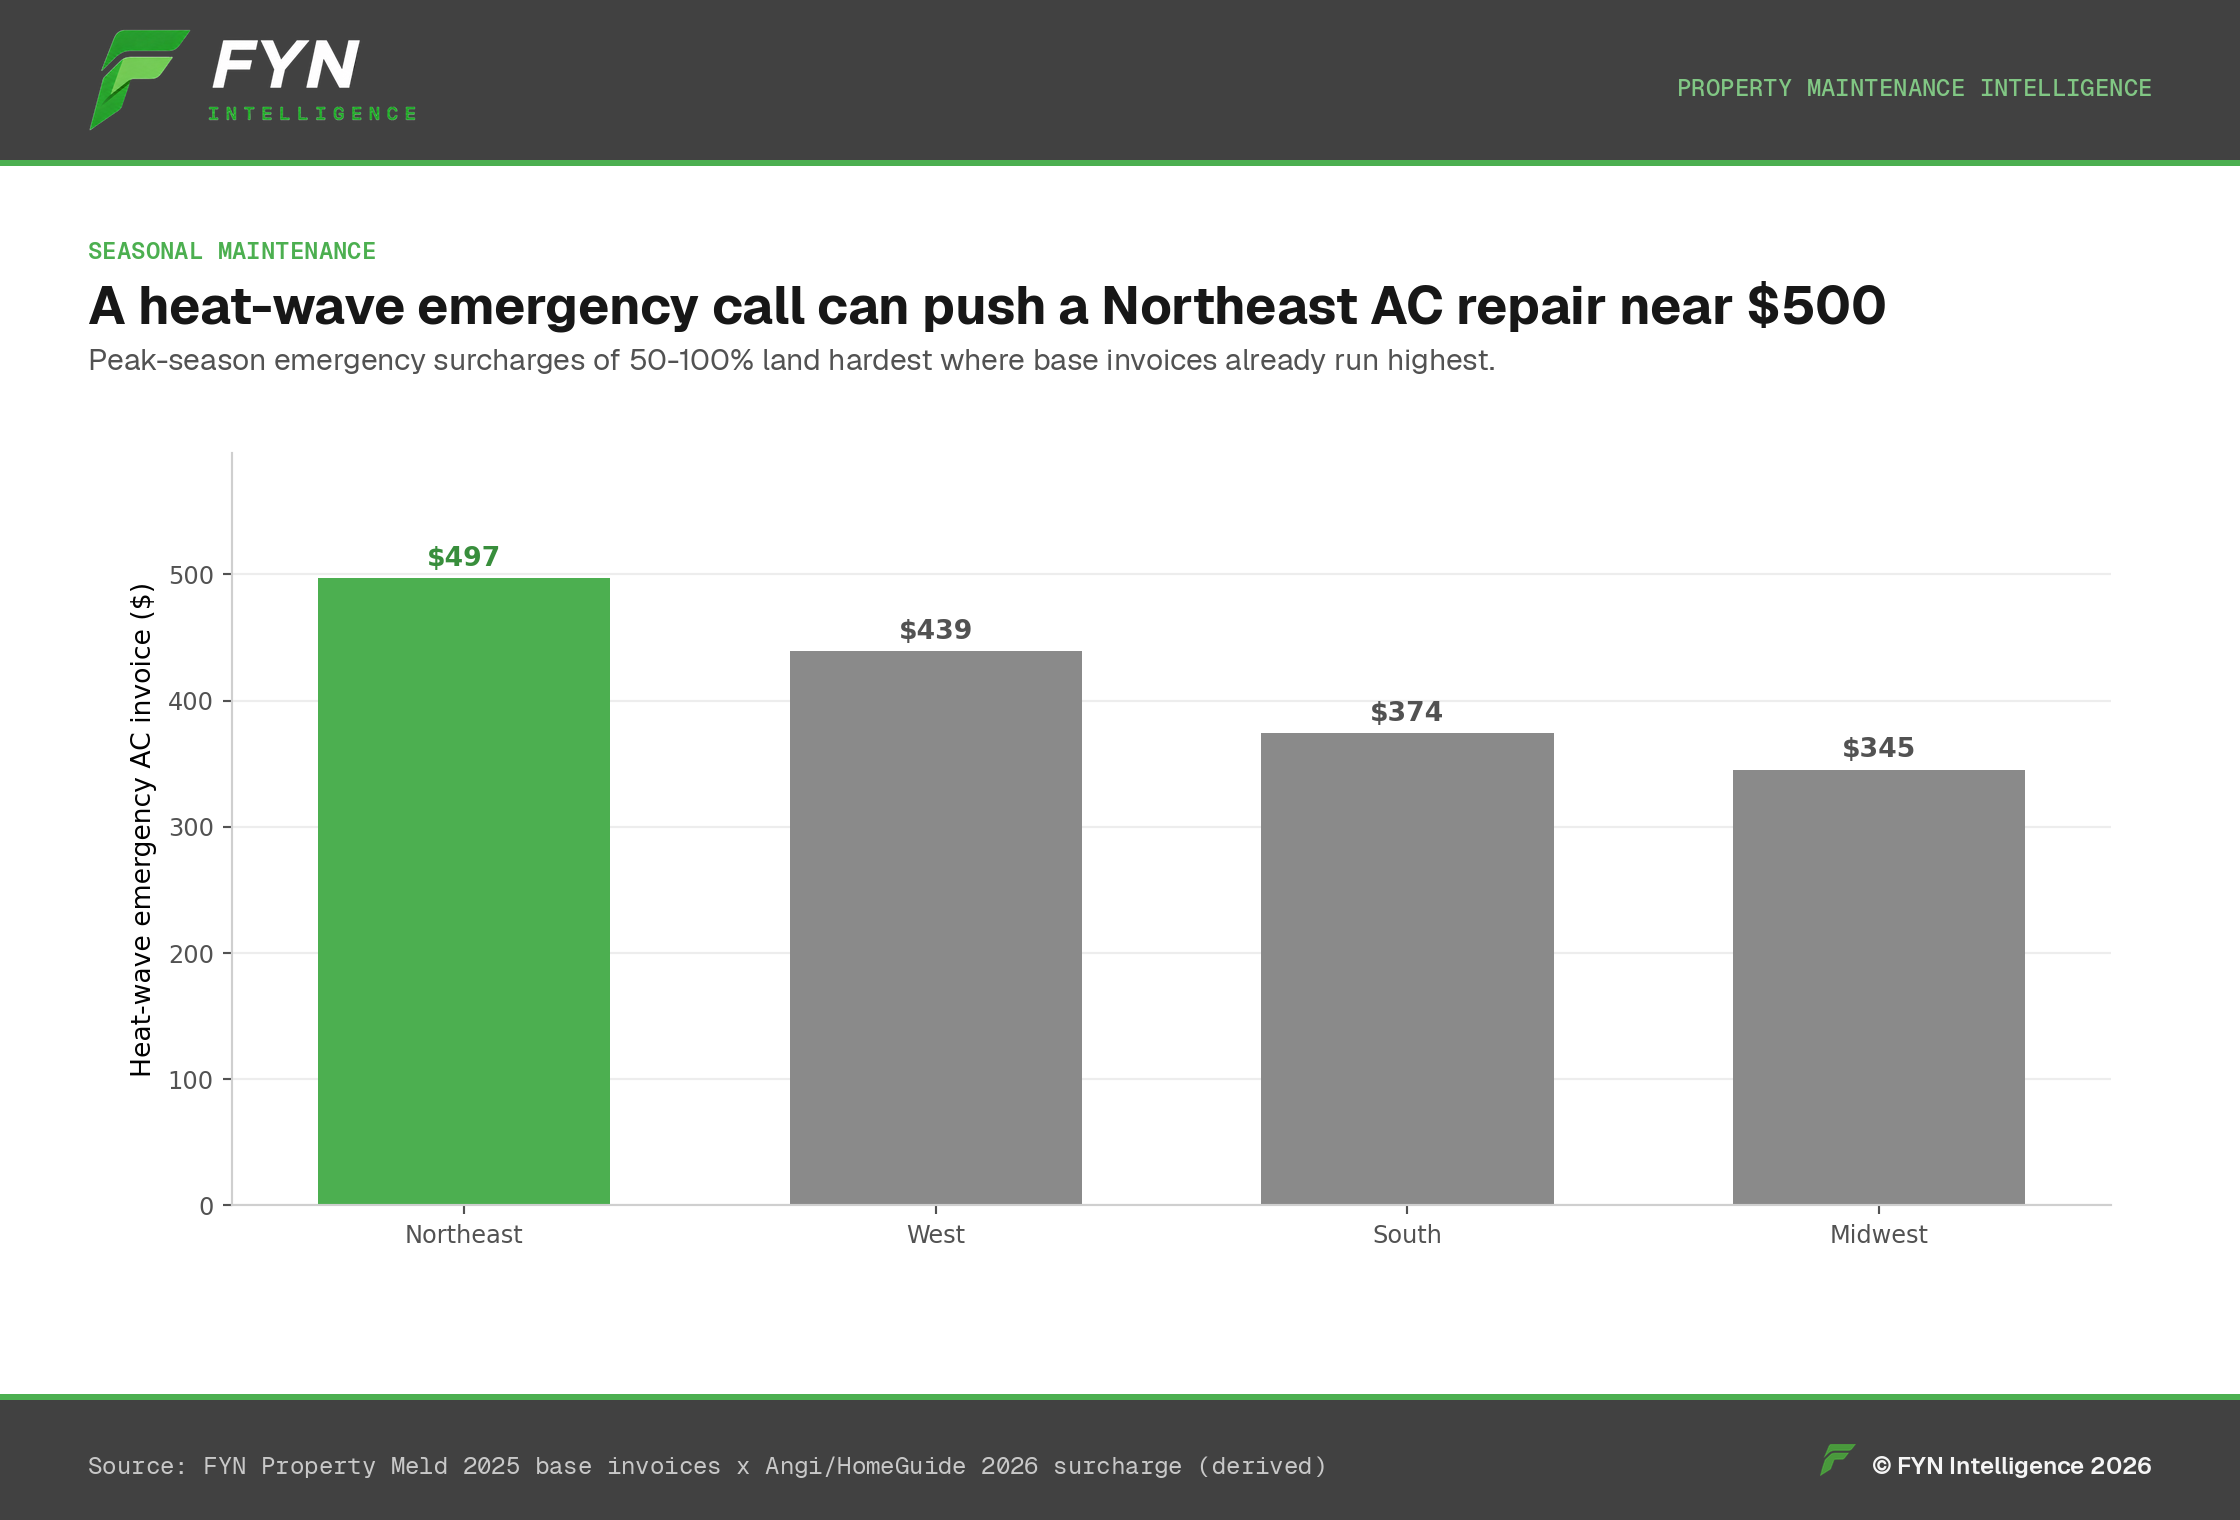
A Heat-Wave Emergency AC Call Can Push a Northeast Repair Near $500
Peak-season surcharges of 50–100% compound hardest in the regions where base invoices are already the highest.
Jul 22, 20265 min read
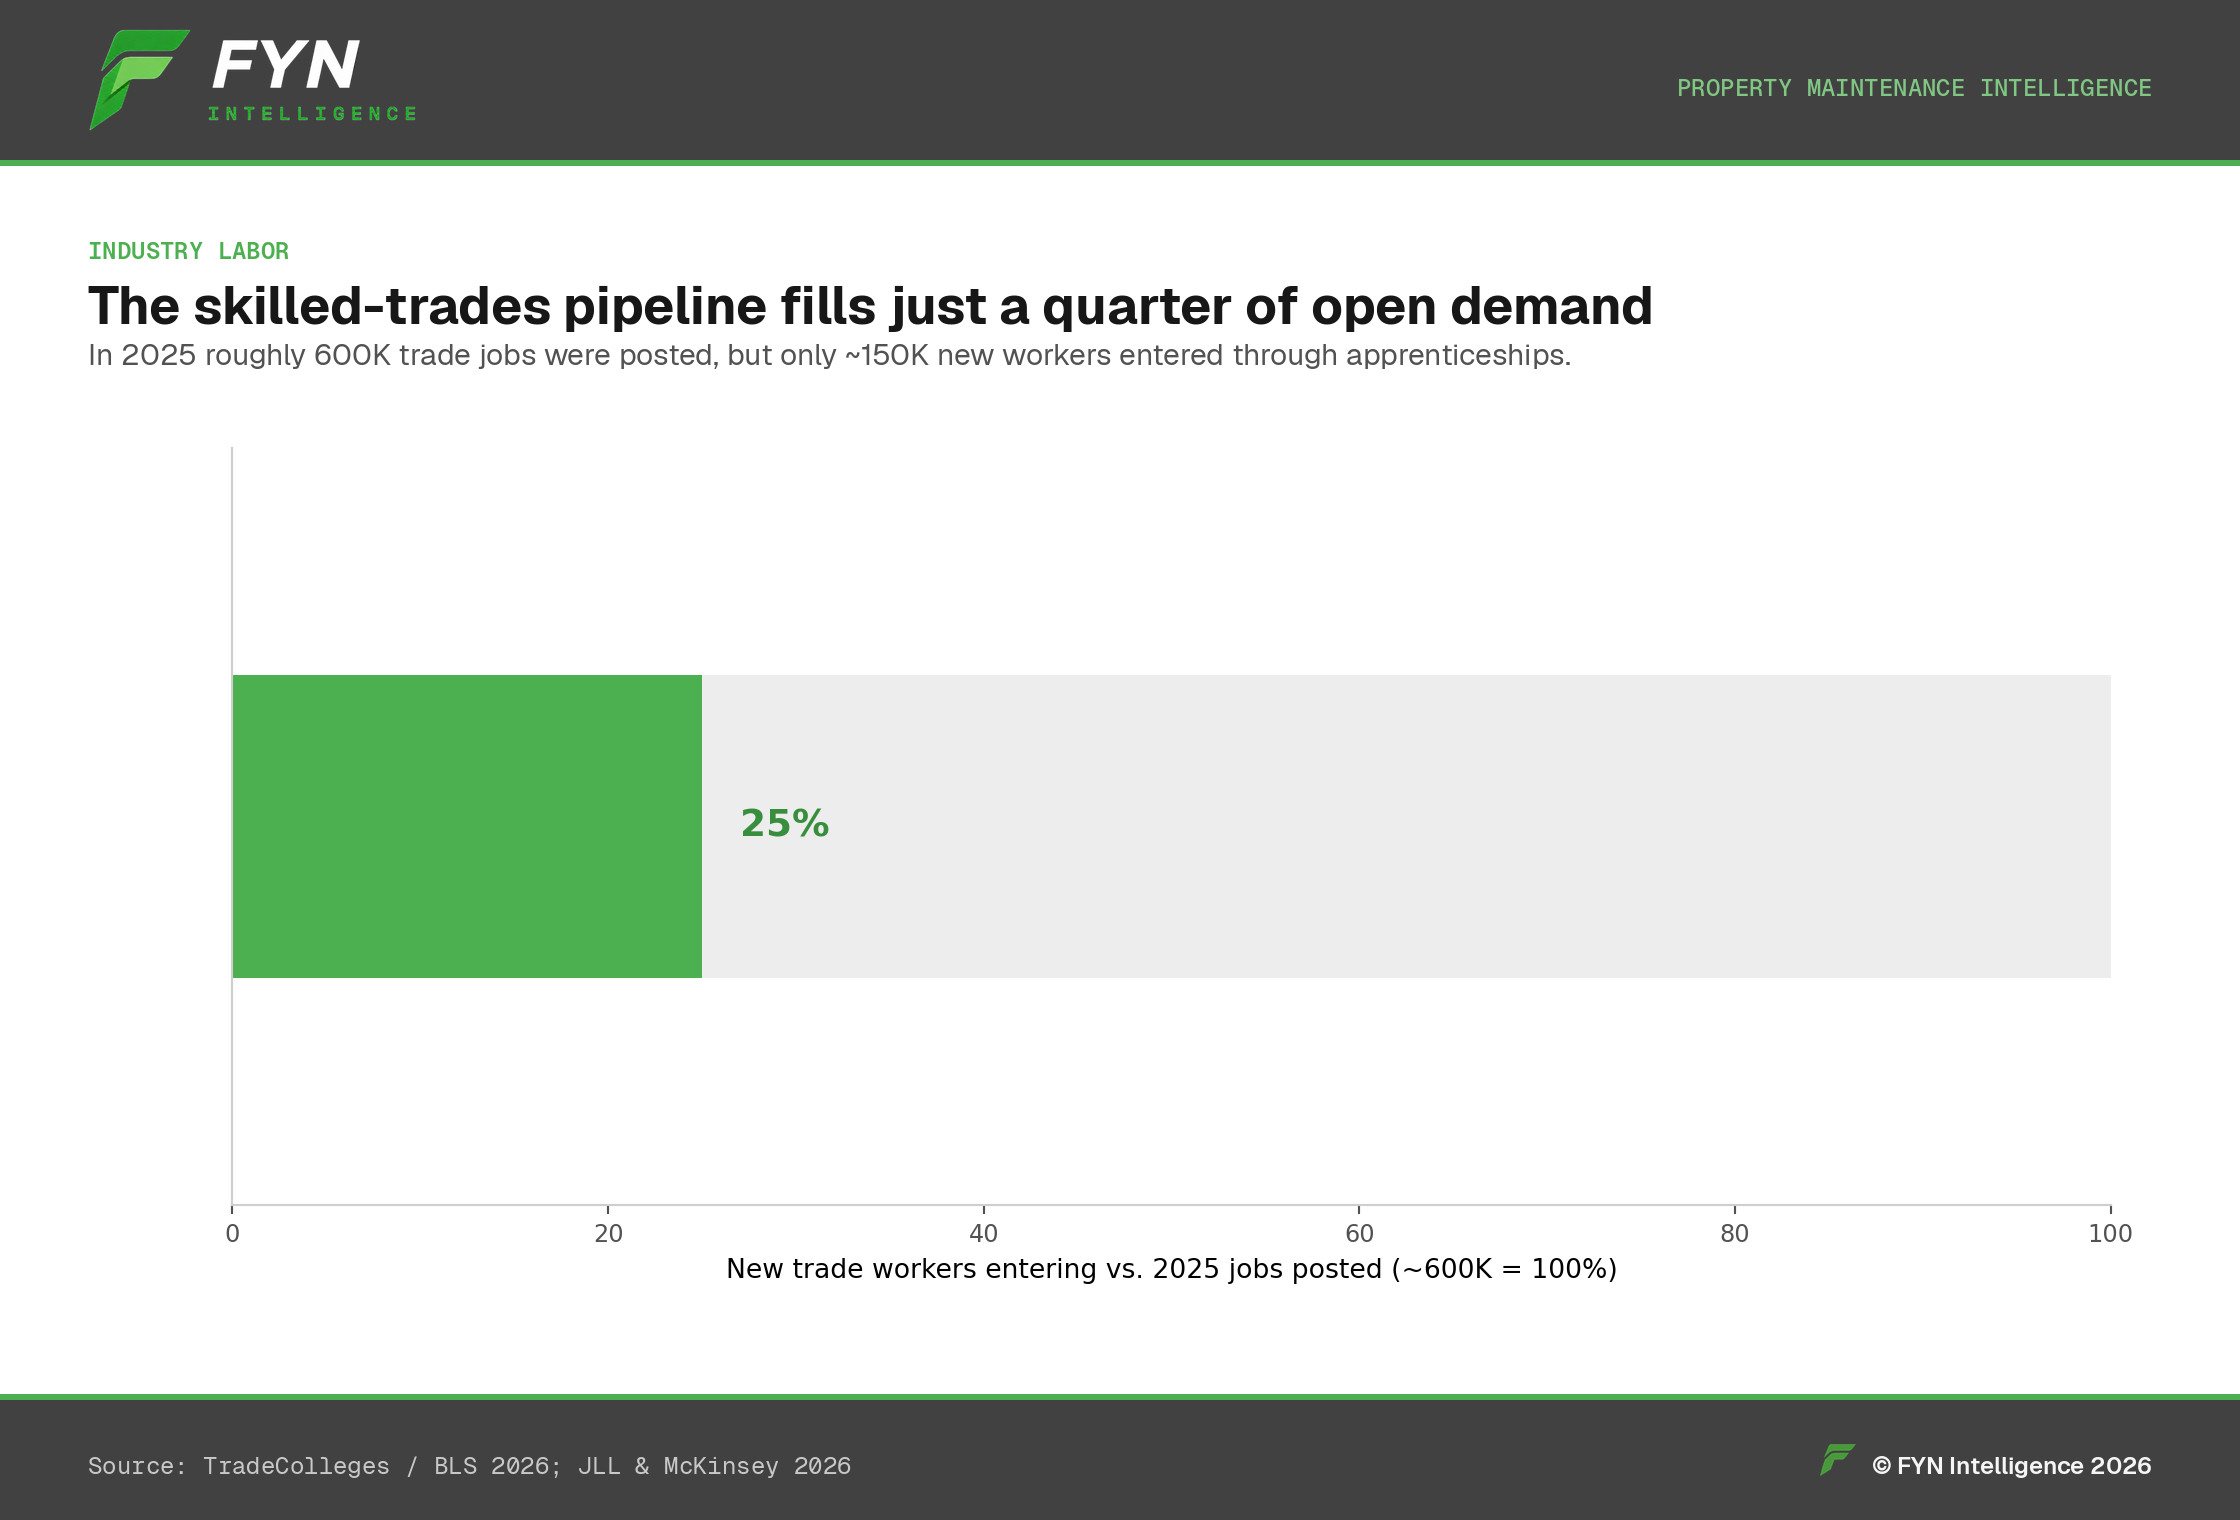
Industry Labor
The Skilled-Trades Pipeline Fills Just a Quarter of Open Demand
Roughly 20 openings for every new worker — and 68% of technicians are already over 45.
Jul 22, 20265 min read